Data Analysis of Ant Social Structures
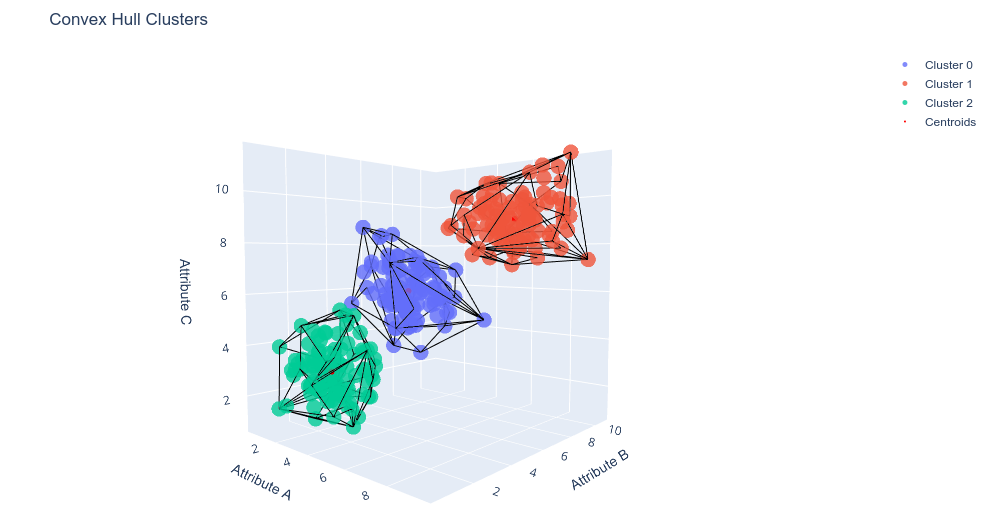
Ants, as social insects, exhibit complex behaviors and organizational structures within their colonies. This project focuses on analyzing and extracting relevant information from ant colonies using the framework of convex sets topology. By studying a dataset collected from an entomology study that measured attributes of 300 ants, including size, mass, and protein density, we aim to understand the roles and tasks of individual ants within the colony. These attributes, standardized for ease of data processing, are believed to determine the ants’ roles within the nest.
Through data analysis, we seek to uncover patterns and relationships within the ant colony, shedding light on the intricate social dynamics and division of labor among ant castes. This research not only provides insights into ant behavior but also showcases the application of data science techniques, such as convex set topology, in studying complex biological systems.
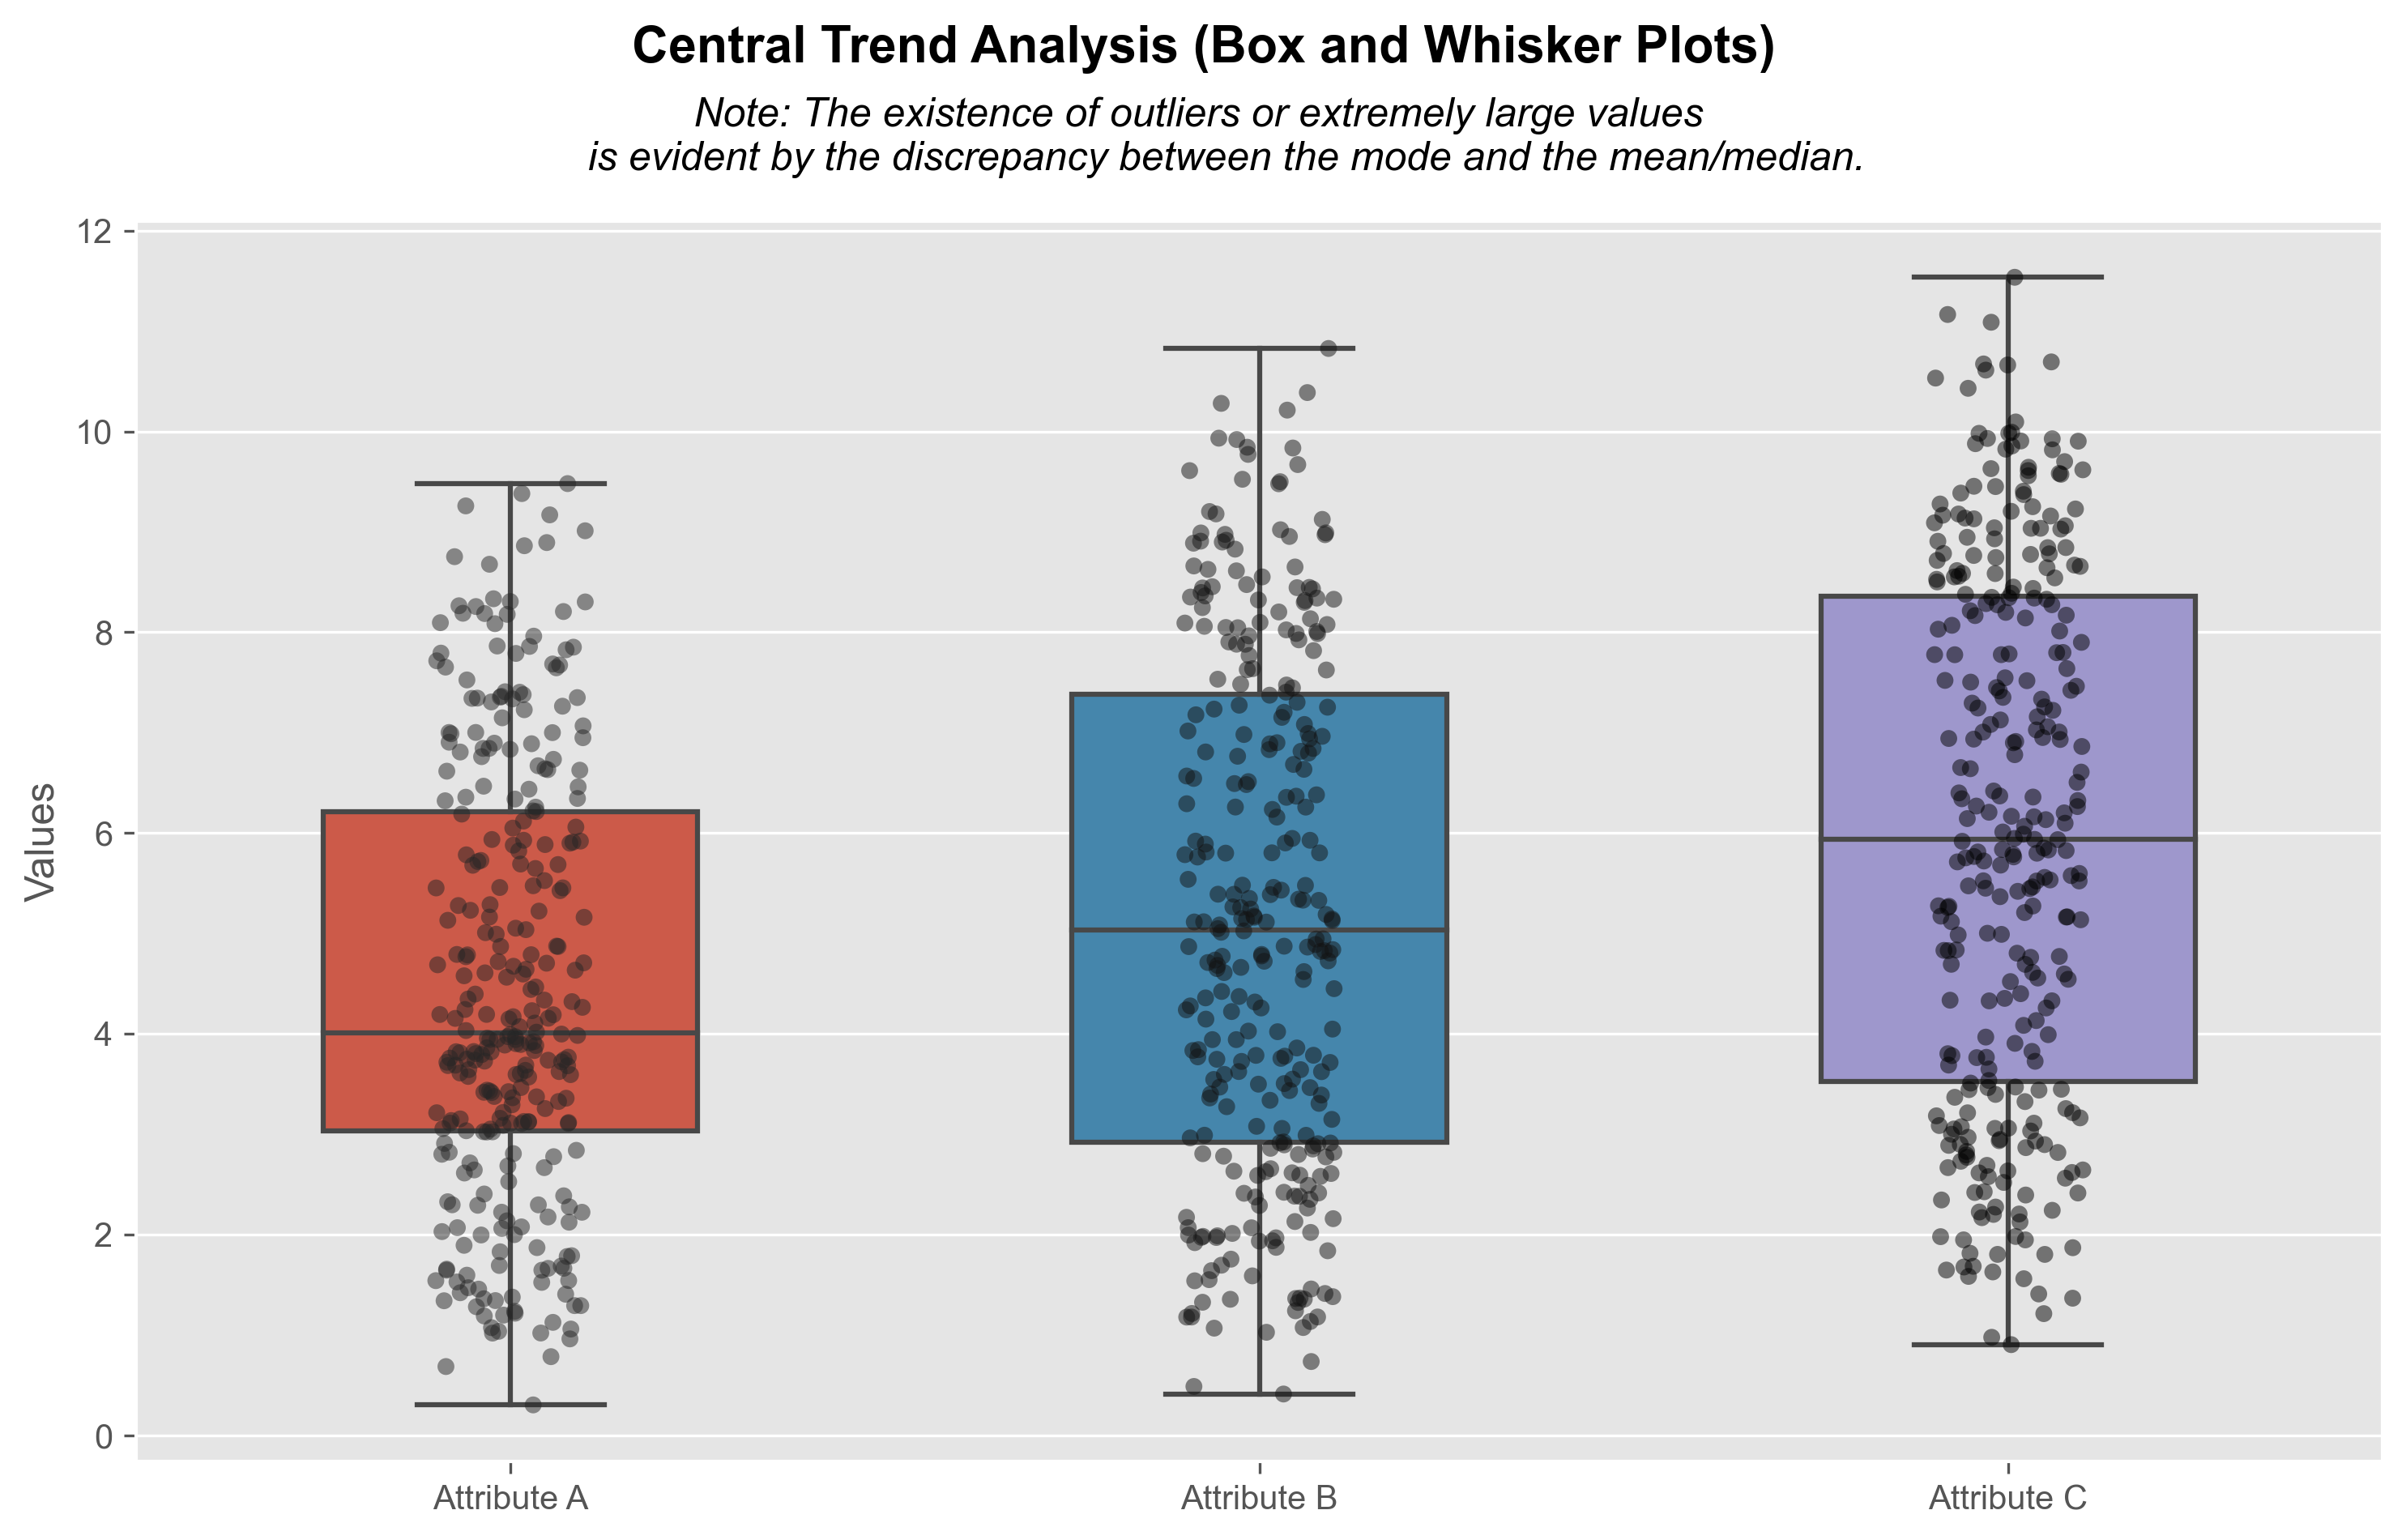
Central Trend Analysis
In general, the mean and median have close values, while there is a significant difference with the mode, which is much lower. This suggests the presence of some outliers or extremely large values in the dataset. The discrepancy between the mode and the mean/median suggests that there is complexity in the distribution of your data. This could be due to asymmetry in the distribution, the presence of outliers.
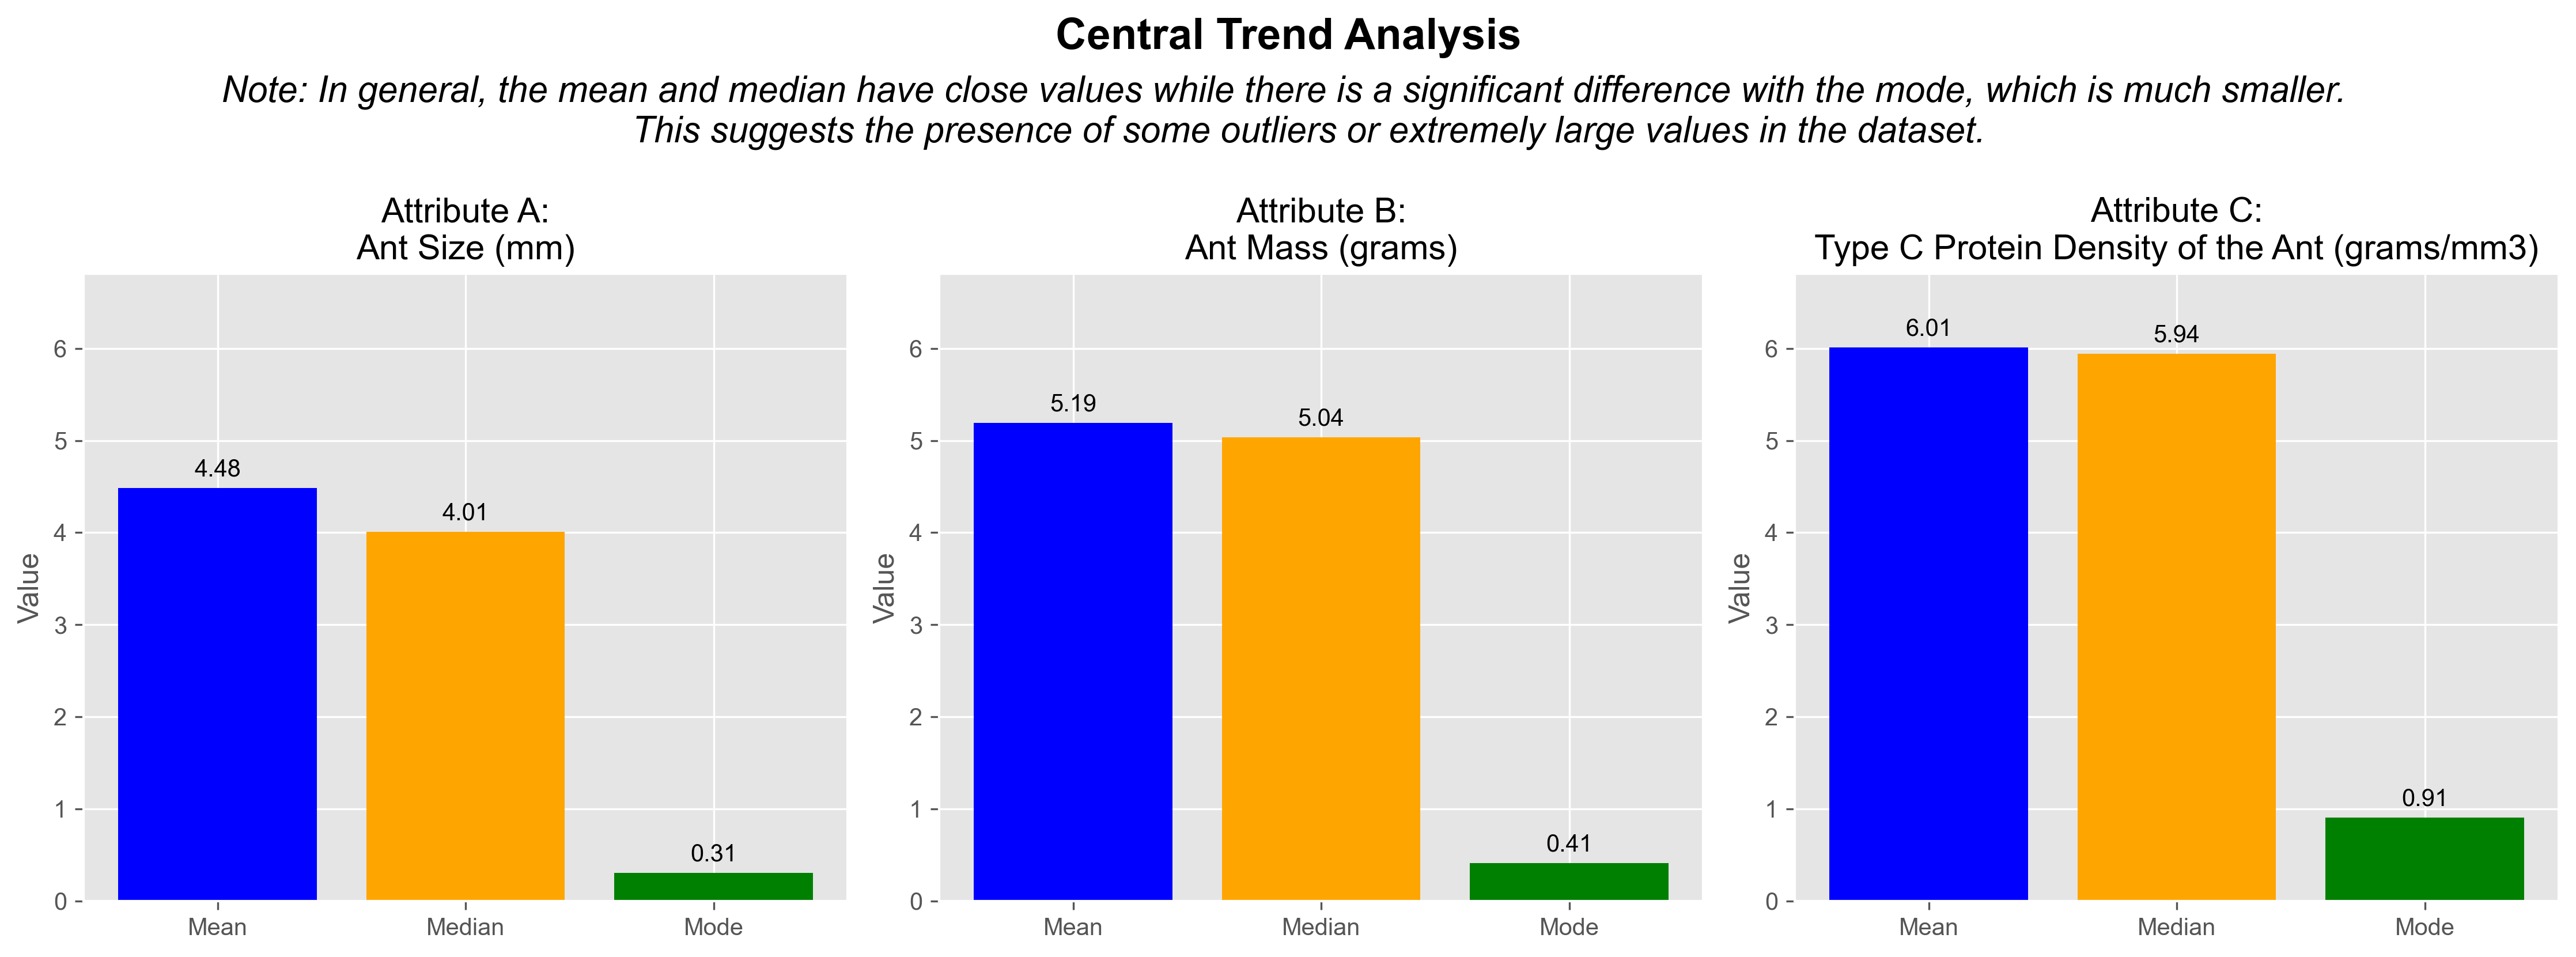
The closeness between the mean and median suggests a symmetric or relatively symmetric distribution of the data. However, the significant difference with the mode, which is much lower, indicates that there are outliers or extremely large values present in the dataset.
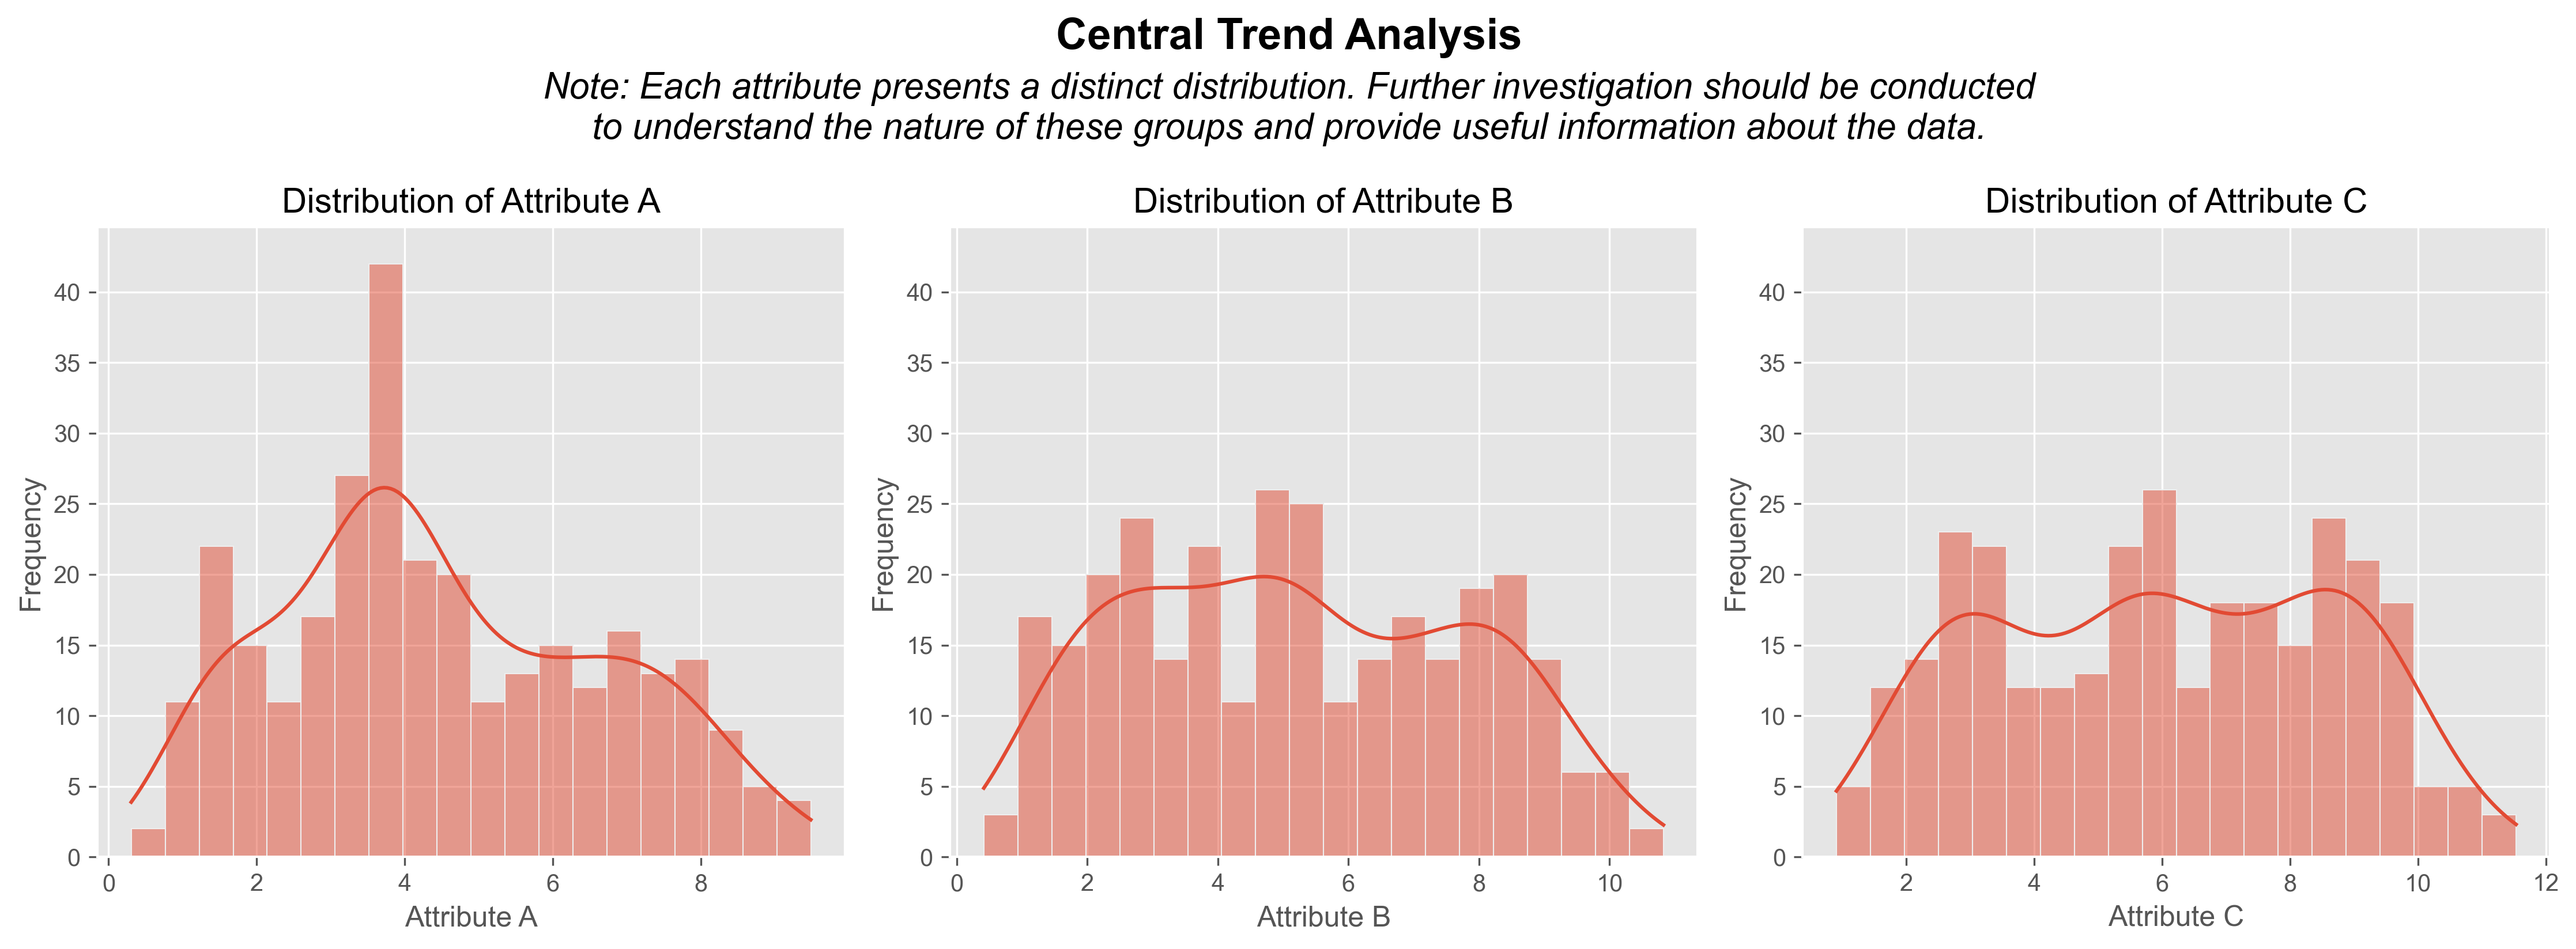
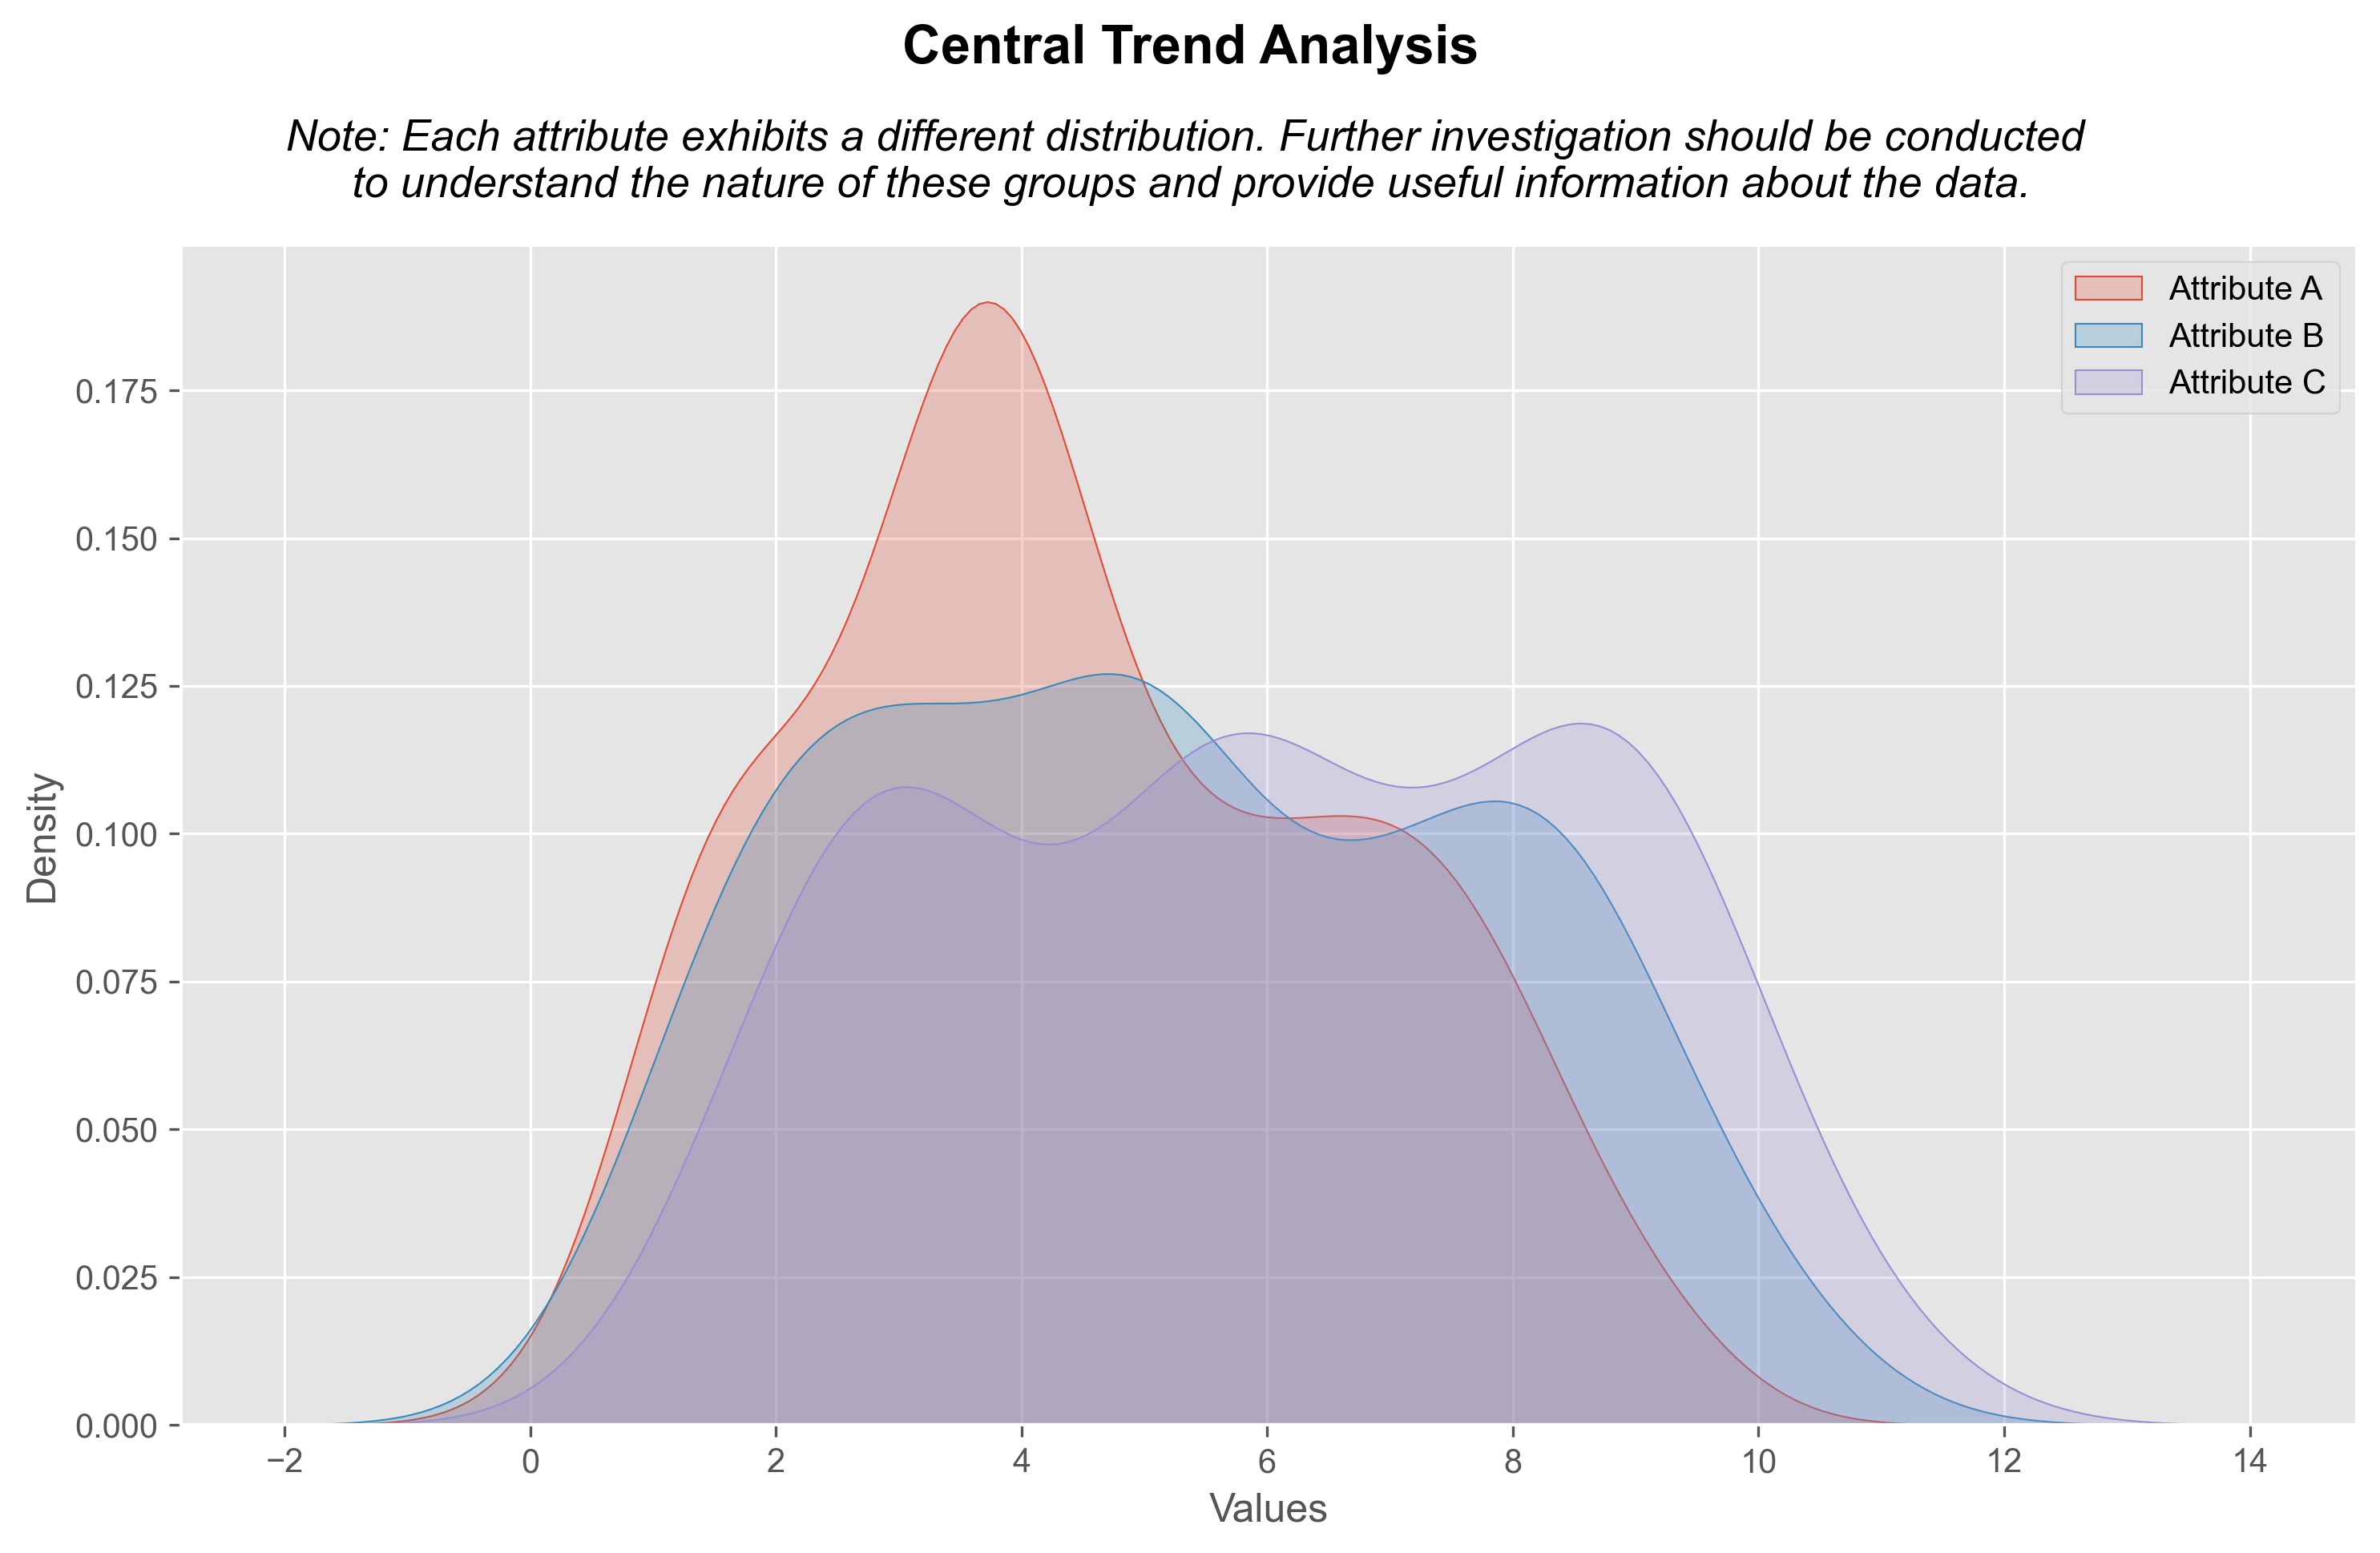
Attribute A: There is a slightly higher peak towards the left. This suggests that most of the values are concentrated on the left side of the distribution, indicating a possible left skew or negative bias. This could mean that there is a concentration of lower values compared to higher values. It would be useful to investigate why this is occurring and if there are specific factors that are contributing to this distribution.
Attribute B: The presence of two peaks in the distribution indicates that there are two distinct groups or subsets of data present in your data. This phenomenon is known as a bimodal distribution. There could be different factors or conditions contributing to the formation of these two groups. Further investigation should be conducted to understand the nature of these groups and provide useful insights into the data.
Attribute C: The presence of three peaks suggests that your data have three distinct groups or subsets with different concentrations of values. This distribution is called trimodal. As with the bimodal distribution, understanding the nature and characteristics of these three groups may be essential to comprehend the underlying dynamics of your data.
Machine Learning Algorithms